MLCC 06031C102K4Z2A Spec Analysis: DC-Bias & Temp Data
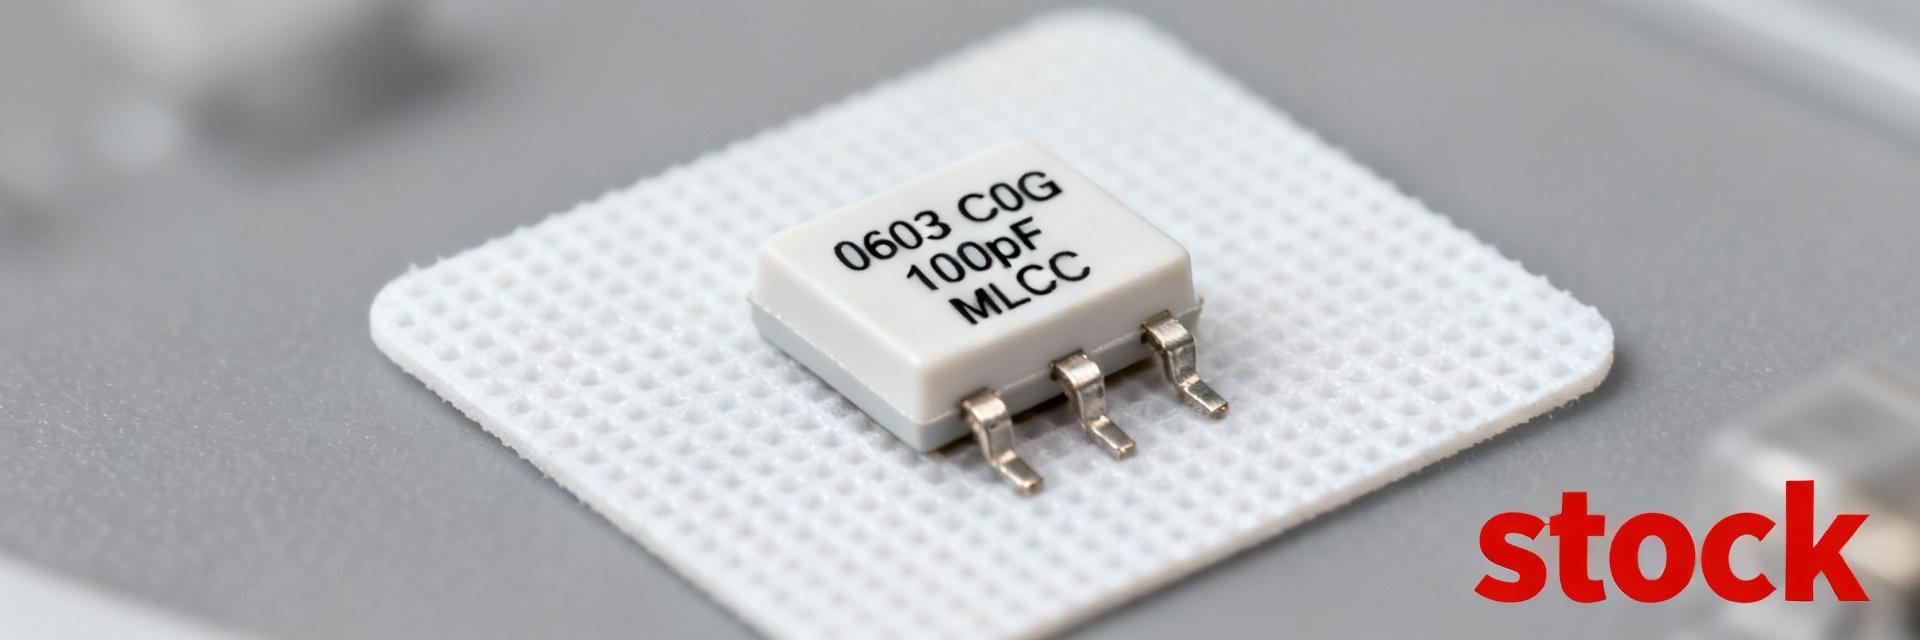
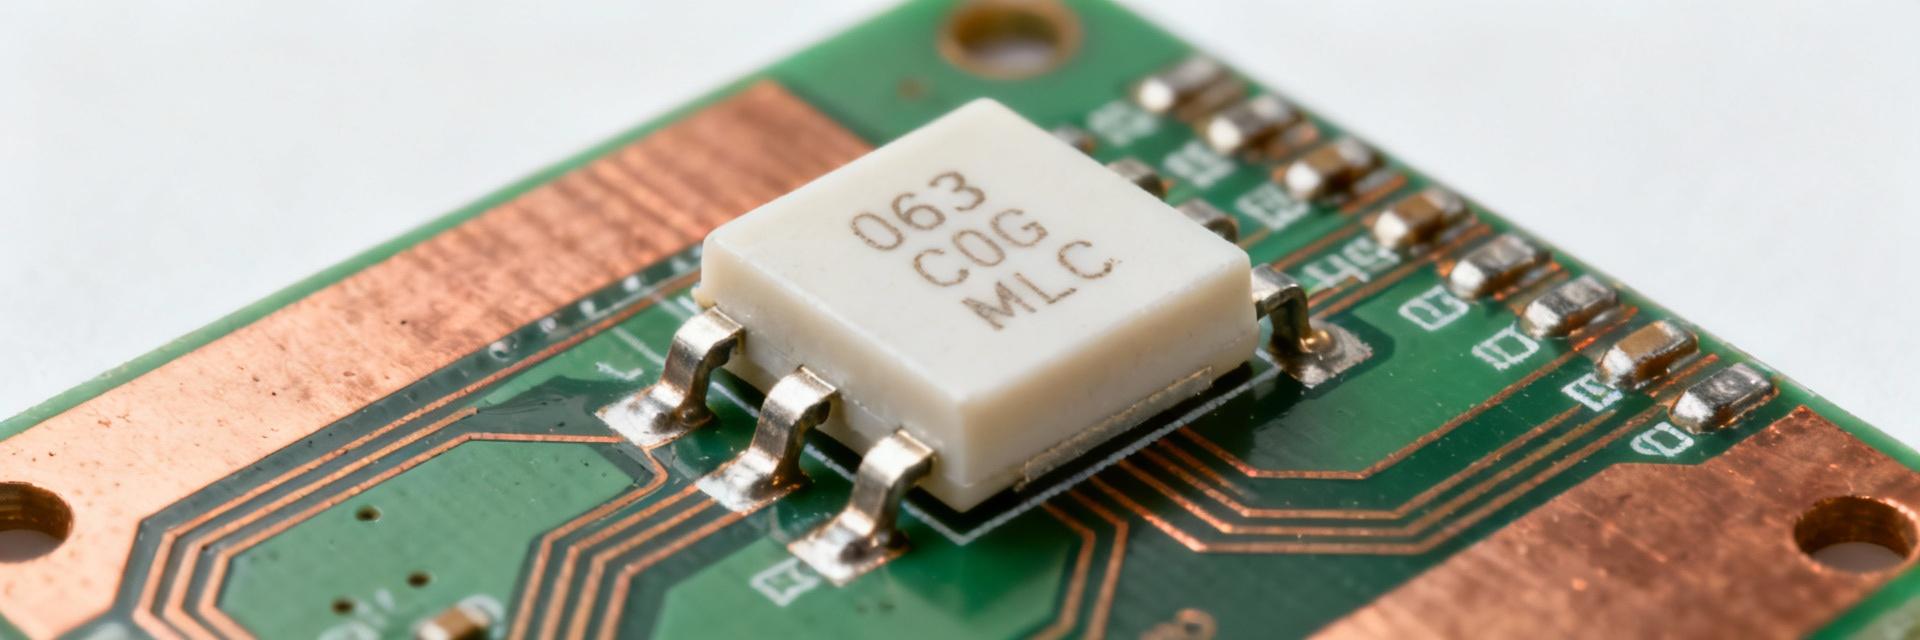
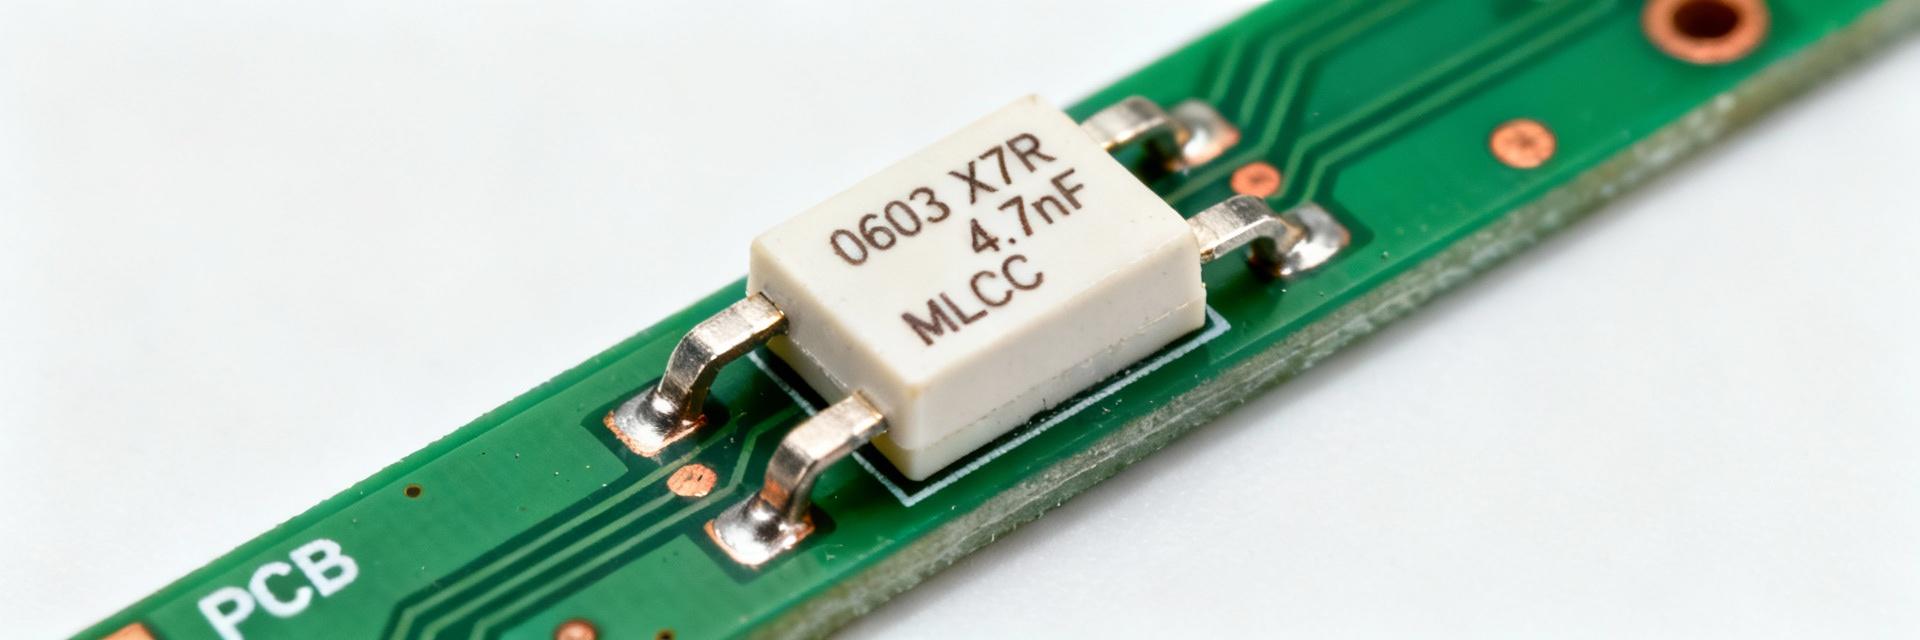
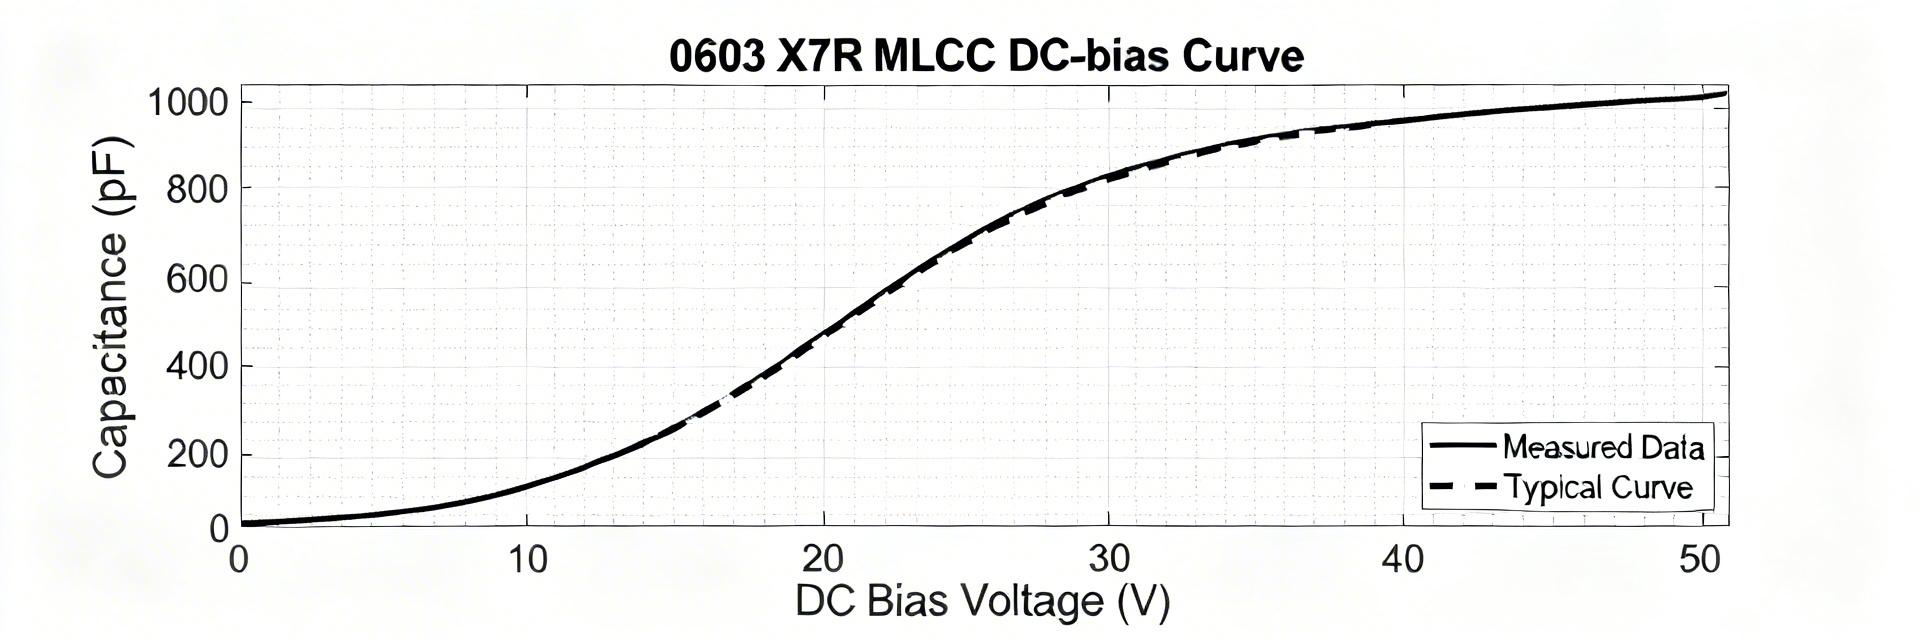
• Point Modern board-level designs rely on multilayer ceramic capacitors for compact decoupling and filtering; understanding their in-circuit value is critical. • Evidence Datasheet trends and independent lab sweeps commonly show X7R 0603 1 nF, 100 V parts losing substantial capacitance under bias and temperature stress. • Explanation This note quantifies expected DC-bias and thermal behavior, outlines a reproducible test protocol, and gives practical mitigation so engineers avoid surprises when MLCCs operate away from 0 V / 25 °C. Background & Key Specs Overview Point: Start by listing the key nominal parameters that drive bias and thermal response. Evidence: For the class discussed, baseline values are package 0603, nominal capacitance 1 nF (1000 pF), rated voltage 100 VDC, tolerance ±10%, dielectric X7R, and an operating range typically spanning -55 °C to +125 °C. Explanation: These fields—capacitance, tolerance, rated voltage, temperature range, dielectric type and size code—should be captured from the datasheet and labeled as “datasheet nominal” vs measured. Part number & package baseline Record the part identifier and baseline numeric specs before testing. For a typical example part number, the nominal list defines the measurement targets. Mark values as “nominal (datasheet)” and reserve a separate column for “measured at 25 °C / 0 V” for BOM reviewers. Why X7R dielectric matters X7R is higher-permittivity but non-linear. EIA Class II dielectrics trade absolute stability for compact capacitance. Designers must expect moderate stability with notable voltage and temperature derating versus C0G/NP0. DC-Bias Behavior: Expected Capacitance vs Voltage Capacitance typically falls as DC-bias increases in X7R MLCCs. The curve shape is a steep initial drop at low-to-moderate voltages, transitioning to a slower asymptotic tail approaching the rated voltage. DC Bias (V) Normalized Capacitance (%) Visual Retention Guide 0 V 100% 10–20 V 85–95% 25 V 80–90% 50 V 60–75% 100 V 45–60% Circuit Implications: An RC low-pass’s cutoff frequency scales inversely with capacitance; a 40% reduction raises fc by 1/0.6 ≈ 1.67×. Recalculate filter poles and transient budgets using measured retention. Thermal Stability X7R typically varies within its class tolerance over -55 °C to +125 °C. Report checkpoints at -55, 0, 25, 85, and 125 °C. Largest shifts usually appear at temperature extremes. Combined Effects Assume multiplicative retention: If retention is 70% at a given bias and 90% at a temperature, worst-case is 63% (0.7 × 0.9). Prefer direct combined-condition measurements when possible. Measurement & Test Methods Recommended Equipment • Precision LCR meter (1 kHz–100 kHz) • Low-ripple DC bias supply • Temperature chamber / Cold-hot stage • 4-terminal Kelvin connection fixtures Test Sequence Baseline at 25 °C / 0 V Voltage sweep (0 V → Rated) at fixed temps Temperature sweeps at fixed bias points Log stabilization time & uncertainty Selection Guidance Suitable where space is premium and moderate derating is acceptable. Avoid in precision timing. Choose NP0/C0G for absolute stability or larger footprints (0805) to reduce DC-bias sensitivity. Layout Checklist Apply voltage derating (design < rated) Parallel multiple MLCCs to recover capacitance Place capacitors close to IC power pins Document retention curves in BOM notes Key Summary &check; Measure normalized capacitance vs DC voltage; use checkpoints (0, 10, 25, 50, 100 V) to recalc RC poles. &check; Report temperature % change vs 25 °C; assume multiplicative retention for worst-case planning. &check; Mitigate with derating, parallel parts, or stable dielectrics; document all measured retention for reproducibility. Frequently Asked Questions &plus; How does 06031C102K4Z2A capacitance change under DC-bias? Measured response: Expect a rapid initial capacitance drop with increasing bias, then a slower tail toward rated voltage. Practical answer: Use the normalized retention table as a starting point and measure n ≥ 5 units at your operating voltages to set design margins. &plus; What measurement frequency should I use to evaluate DC-bias? Answer: Choose frequencies matching the application—1 kHz for timing/AC coupling and 10–100 kHz for decoupling or switching supplies. Record retention at multiple frequencies if used across a broad spectral band. &plus; How should I report and apply combined DC-bias and temperature results? Answer: Prefer direct combined-condition tests (bias applied during temperature sweep). If unavailable, multiply independent retention factors conservatively and explicitly note uncertainty in the BOM.
2026-02-12 11:17:12